
本教程是由Lynda机构出品的Illustrator数据可视化视频教程,Lynda.com Creating Infographics with Illustrator,时长:4小时17分,大小:463 MB,格式:FLV高清视频格式,教程使用软件:Illustrator CS6,作者:Mordy Golding,官方发布时间:2013年3月11日,语言:英语。人人素材网理发布。
Adobe Illustrator是出版、多媒体和在线图像的工业标准矢量插画软件。无论是生产印刷出版线稿的设计者和专业插画家、生产多媒体图像的艺术家、还是互联网页或在线内容的制作者,都会发现Illustrator 不仅仅是一个艺术产品工具。该软件为您的线稿提供无与伦比的精度和控制,适合生产任何小型设计到大型的复杂项目。
Digital-Tutors机构是号称全球最大的CG付费教程网站,2000多万次视频播放记录,顶级客户的优秀项目实例,被誉为教学和娱乐结合的最好的教程,RenderMan创建人称之为“完美的学习站点”,成立至今已经有12年之久,内容集中在视频制作和游戏制作两大板块,其网站完整的教学的理念,先进的技术支持(他们甚至开启了移动手机看教程的计划,支持IPAD/IPHONE/ANDROID),都让人耳目一新。尤其是多层级的教学难度设置,有趣的考试内容,时不时的竞赛,让DT成为非常活跃的一个CG机构。
Lynda.com Creating Infographics with Illustrator
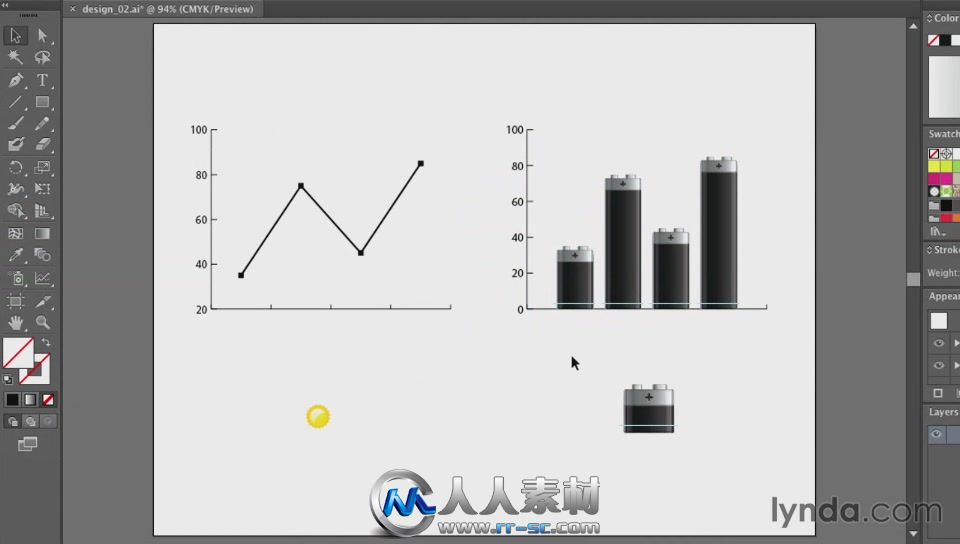
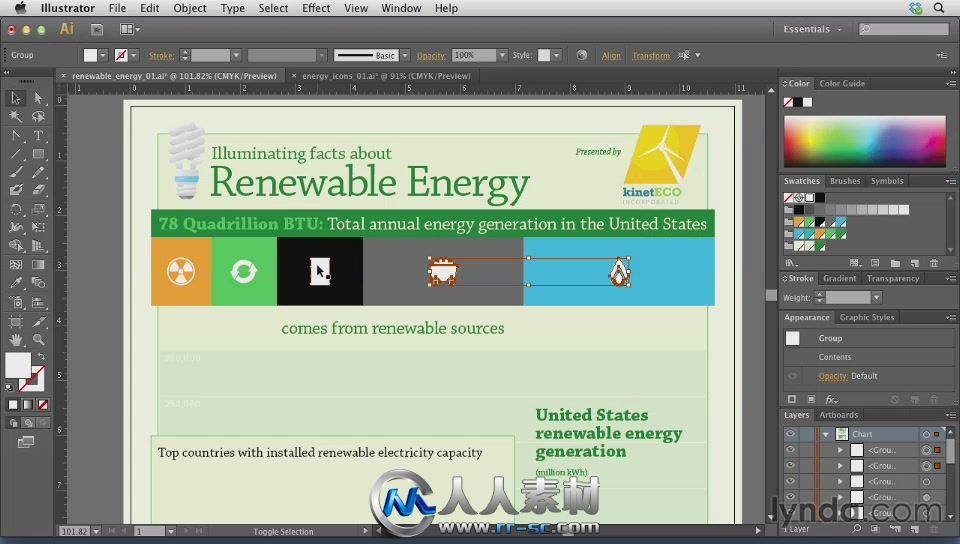
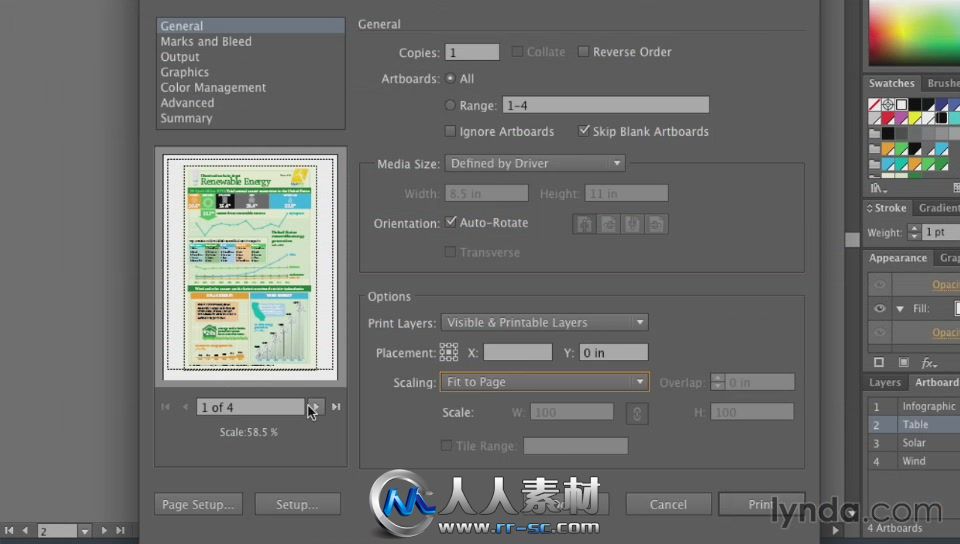
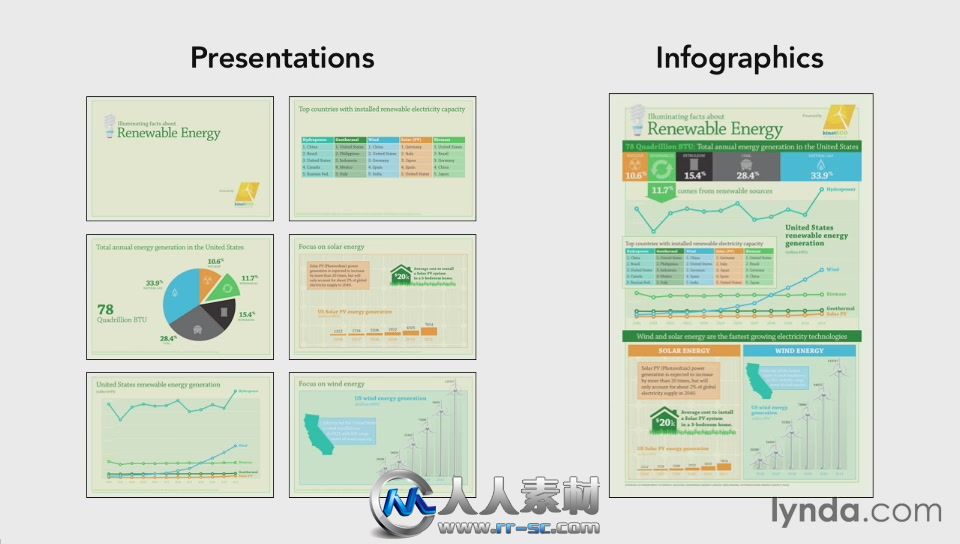
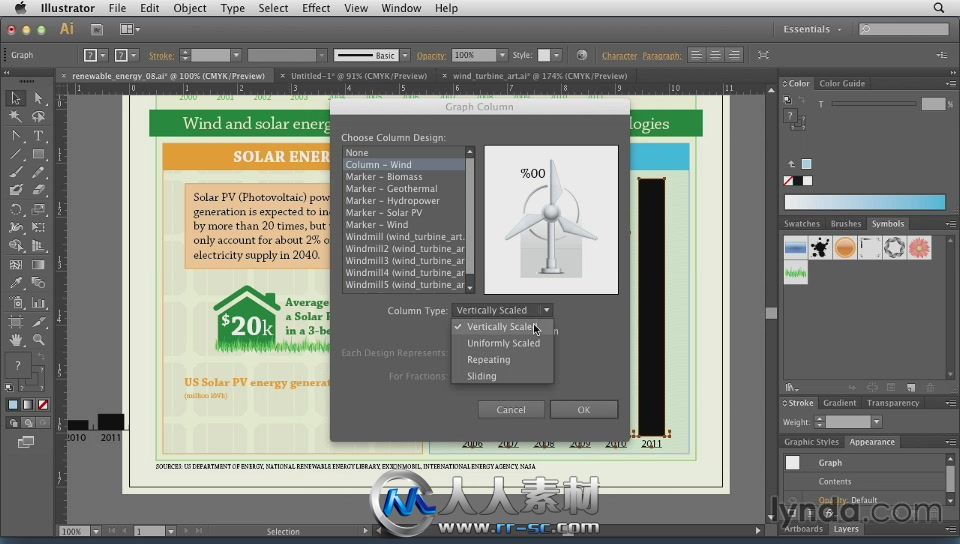
Infographics provide a unique way to visualize your data and trace the story behind it. Join author Mordy Golding in this course as he introduces you to designing charts, graphs, and other infographics in Adobe Illustrator. Mordy reveals five key components to a great information design, and shows how to determine which of the types of graphs available in Illustrator is right for your data. The final chapter takes you step-by-step through the creation of an infographic about renewable energy, using charts, tables, patterns, and text. Plus, Mordy demonstrates how to maximize your export options by creating a file with multiple layers and artboards.
下载地址:
或者
http://pan.baidu.com/share/link?shareid=384652&uk=2117035120
或者
《Illustrator数据可视化视频教程》www.rr-sc.com-RRJC10485.rar (389.27 MB)
或者
 VIP独享高速地址.txt
(88 Bytes, 下载次数: 1093)
解压密码:
|


 /2
/2 